

Somehow even wiki https://en.wikipedia.org/wiki/Bias%E2%80%93variance_tradeoff
seems not clearly explained what it is due to un-cleary math denotion.
Here we refer to: model/algorithm’s bias and variance ( not the data itself ).
The video gave us more precision meaning of bias, variance.
Expected error of algorithm
the goal of the algorithm is to reduce the total error when we do the prediction/(generalization).
Thus we need to calculate the expected error of the algorithm over prediction data set.
by math:
expected error of an algorithm: (x,y) are draw from samples ( for testing or prediction), D is training set.
![{\displaystyle \operatorname {E} _{D}{\Big [}{\big (}y-{\hat {f}}(x;D){\big )}^{2}{\Big ]}={\Big (}\operatorname {Bias} _{D}{\big [}{\hat {f}}(x;D){\big ]}{\Big )}^{2}+\operatorname {Var} _{D}{\big [}{\hat {f}}(x;D){\big ]}+\sigma ^{2}}](https://wikimedia.org/api/rest_v1/media/math/render/svg/d5a2f3d7e452720a1f105dff963ad490221a4a80)
where
![{\displaystyle \operatorname {Bias} _{D}{\big [}{\hat {f}}(x;D){\big ]}=\operatorname {E} _{D}{\big [}{\hat {f}}(x;D){\big ]}-f(x)}](https://wikimedia.org/api/rest_v1/media/math/render/svg/a0013efa4f5587aa74b8c5511bf4b5864c3f5c56)
![{\displaystyle \operatorname {Var} _{D}{\big [}{\hat {f}}(x;D){\big ]}=\operatorname {E} _{D}[{\big (}\operatorname {E} _{D}[{\hat {f}}(x;D)]-{\hat {f}}(x;D){\big )}^{2}].}](https://wikimedia.org/api/rest_v1/media/math/render/svg/00217394951130843b79dfb8bbd6e2374515bbbf)
The E[f^(x,D)] means: expected fitting function/classifier, which means:
- for one training set D, we can train the model to get f^(x),
- for another training set D, we can get another f^(x),
when we average all those training sets Ds, we get the E[f^(x, D)].
f(x) is the real /ground truth.
Variance
The variance means the difference between the one particular classifier/regression function draw from one particular D and expected regress/classifier.
low variance means: we almost get the same/similar regression function even if the training set is different. for example: some linear functions.
variance refers to the sensitivity of a model to variations in the training data.
When a model has high variance, it is overly complex and tends to fit the noise or small fluctuations in the training data. As a result, the model’s predictions can vary significantly for different instances in the training data. This high sensitivity to small fluctuations means the model is not generalizing well to new, unseen data. In other words, the model has “memorized” the training data and might not perform well on new data points.
High variance normally associated with term Overfitting: Occurs when a model has high variance and fits the training data extremely closely, including noise. It performs well on the training data but poorly on new data due to its lack of generalization.
A fix for that: use less expressive model, add regulation items etc.
Bias
The bias: the difference between my expected regress/classifier and real regression/classifier. the expected one is the best this algorithm can do, that means it captures the limitation of this algorithm.
thus the bias of the model/algorithm.
Squared difference between real x, f(x) and best possible prediction using our “long-term” expectation
for what the learner will do if we averaged over many datasets D.
Bias refers to the error that is introduced by approximating a real-world problem, which may be complex, by a simplified model.
A model with high bias is one that makes strong assumptions about the underlying data distribution, which might not capture the true relationships in the data. As a result, the model consistently produces predictions that are far from the actual values. In other words, high bias leads to systematic errors.
For example, if you’re trying to fit a linear regression model to data that has a non-linear relationship, the linear model might have high bias because it can’t accurately capture the curvature in the data.
linear function to fit curve. no matter what we did, there are bias there.
High bias: normally associated with term: under-fitting, Occurs when a model has high bias and oversimplifies the underlying patterns in the data. It performs poorly both on the training data and new data.
The way to fix it is to : increase model’s expressive ( or more complicated/powerful model)
the irreducible error

Since all three terms are non-negative, the irreducible error forms a lower bound on the expected error on unseen samples
Key to understanding
The key to understanding is thinking of using multiple ( more than 2 for better understanding) different training data set, what are those bias/variance terms’ errors over predict set.
For bias: if low, means no matter what training set, it almost gives us the similar/same regress/classifier.
For variance: if high, it means different training set will give different regress/classifier.
Bias-Variance Trade-off:
In machine learning, there is a trade-off between bias and variance. As you increase the complexity of a model (e.g., adding more features, using higher-degree polynomials), you generally decrease bias and increase variance. Conversely, as you simplify a model, you increase bias but decrease variance.
The goal is to strike a balance between bias and variance that results in a model that generalizes well to new, unseen data. This balance minimizes the total error, which is the sum of bias squared and variance.
General graph:
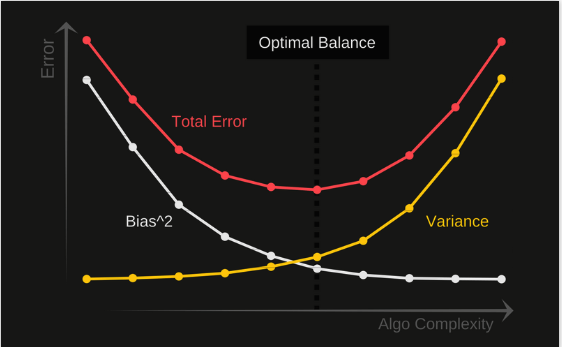
For each Algo, we can calculate Total Error, bias, variance ( over the all Training Ds, and prediction set (x, y), thus we get the figure above.
how to measure model’s variance?
Measuring a model’s variance involves assessing how much the model’s predictions vary for different instances in the dataset. Variance in this context reflects the model’s sensitivity to variations in the training data. Here are a few approaches to measure a model’s variance:
1. Cross-Validation: Cross-validation involves splitting the dataset into multiple subsets (folds), training the model on one subset, and evaluating its performance on the other. By repeating this process with different subsets as the validation set, you can observe how much the model’s performance varies across different data splits. If the model’s performance varies significantly between folds, it indicates higher variance.
2. Learning Curves: Learning curves show how a model’s performance changes as the training dataset size increases. If the training and validation curves are converging closely, it suggests low variance. If there’s a significant gap between them, the model might have high variance, as it’s struggling to generalize to new data.
3. Bootstrapping: Bootstrapping involves repeatedly resampling the training data to create multiple training sets. You train the model on each of these sets and then observe how the model’s predictions vary across these bootstrapped datasets. If the model’s predictions are inconsistent across different bootstrapped samples, it suggests higher variance.
4. Holdout Validation: By splitting the dataset into a training set and a validation set, you can train the model on the training set and evaluate it on the validation set. Repeating this process multiple times with different random splits can give you an idea of how much the model’s performance varies.
5. Out-of-Bag (OOB) Error (for Bagging Models): For ensemble models like Random Forest, the out-of-bag error can be used as an estimate of model variance. Since each base model in the ensemble is trained on a subset of the data, the instances not included in a base model’s training subset can be used to estimate its performance variance.
6. Repeated Experiments: If you have the ability to collect new data or simulate different data scenarios, you can train and test the model on multiple independent datasets. Comparing the model’s performance across these experiments can help you assess its variability.
Remember that while these methods can provide insights into a model’s variance, it’s important to consider multiple evaluation metrics and techniques together. A combination of cross-validation, learning curves, and other variance measurement methods will offer a more comprehensive view of your model’s behavior.
how to get a low bias and low variance model?
Achieving a low bias and low variance model is a key goal in machine learning because it signifies that the model can generalize well to new, unseen data while capturing the underlying patterns of the data. This balance is often referred to as the bias-variance trade-off. Here’s how you can work towards achieving a model with low bias and low variance:
1. Feature Selection and Engineering:
- Choose relevant features that have a strong impact on the target variable.
- Remove irrelevant or redundant features that might introduce noise.
2. Model Complexity:
- Aim for a model that is complex enough to capture the underlying patterns but not overly complex that it fits noise in the data.
- Select an appropriate model type and complexity based on your problem (linear models, decision trees, neural networks, etc.).
3. Regularization:
- Use regularization techniques (like L1 or L2 regularization) to prevent models from becoming too complex.
- Regularization helps control overfitting and reduces variance.
4. Cross-Validation:
- Utilize techniques like k-fold cross-validation to evaluate your model’s performance on different subsets of the data.
- This helps estimate how well your model will generalize to new data.
5. Hyperparameter Tuning:
- Fine-tune hyperparameters to find the optimal balance between bias and variance.
- Grid search, random search, or more advanced optimization techniques can be used.
6. Ensemble Methods:
- Combine multiple models through ensemble techniques like bagging (e.g., Random Forest) or boosting (e.g., AdaBoost, Gradient Boosting).
- Ensembles can help mitigate bias and variance issues by combining the strengths of multiple models.
7. Error Analysis:
- Analyze the errors your model makes on the training and validation data.
- Identify if the errors are due to systematic bias or high variance, and adjust your model accordingly.
8. Data Augmentation:
- Increase the amount of training data by using data augmentation techniques, especially in cases where you have limited data.
- This can help the model learn more diverse patterns.
9. Regular Monitoring and Updating:
- Continuously monitor your model’s performance in real-world scenarios.
- Update your model as new data becomes available to ensure it adapts to changing patterns.
Remember that achieving a perfect balance between bias and variance is often not possible due to the inherent trade-off. The goal is to find the right trade-off that works well for your specific problem domain and dataset. It’s also important to be aware that reducing bias often increases variance, and vice versa. Experimentation, validation, and iterative improvement are key to achieving a good balance.
More documents/details at:
https://www.cs.cmu.edu/~wcohen/10-601/bias-variance.pdf
https://en.wikipedia.org/wiki/Bias%E2%80%93variance_tradeoff